
2B Lab 5 Week 7
This is the pair coding activity related to Chapter 12.
Task 1: Open the R project for the lab
Task 2: Create a new .Rmd file
Task 3: Load in the library and read in the data
The data should already be in your project folder. If you want a fresh copy, you can download the data again here: data_pair_coding.
We are using the packages rstatix, tidyverse, qqplotr, and car today.
Just like last week, we also need to read in dog_data_clean_wide.csv.
Task 4: Tidy data & Selecting variables of interest
Let’s define a potential research question:
How does the type of interaction with dogs (control, indirect contact, direct contact) affect Positive Affect (PA) scores on the PANAS?
To get the data into shape, we should select our variables of interest from dog_data_wide and convert the intervention group into a factor . Store this reduced dataset in an object called dog_anova.
Task 5: Model creating & Assumption checks
Now, let’s create our ANOVA model.
According to our research question, we have the following model variables:
- Dependent Variable (DV): levels of positive emotions, as assessed by the PANAS, at post intervention
- Independent Variable (IV): Intervention Group (control, indirect contact, direct contact)
As a reminder, the ANOVA model has the following structure:
Let’s use this approach with our variables and store the model in a separate object called mod:
Lets check some assumptions:
You see the following output.
ggplot(dog_anova, aes(sample = PANAS_PA_post, fill = GroupAssignment)) +
  stat_qq_band(alpha = 0.5) +
  stat_qq_line() +
  stat_qq_point() +
  facet_wrap(~GroupAssignment) +
  theme_bw() +
  scale_fill_viridis_d()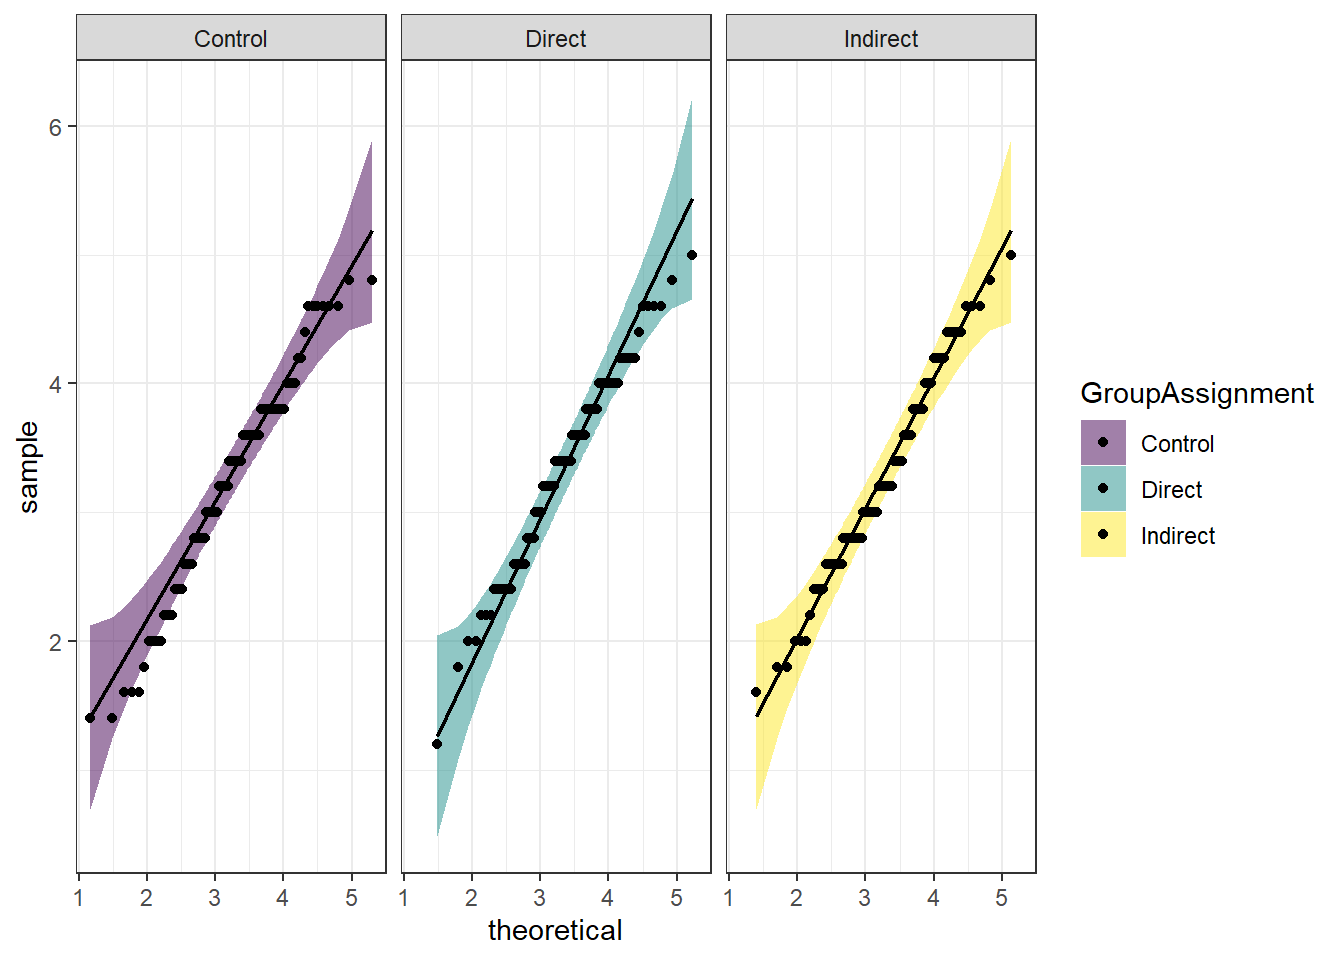
- Which assumption was checked in the plot above?
- Does the assumption hold?
You run the line of code above and the outcome of the Levene’s test is reported as \(F(2,277) = 0.68, p = .507\). What does that mean?
Task 6: Interpreting the output
| Effect | DFn | DFd | F | p | p<.05 | pes |
|---|---|---|---|---|---|---|
| GroupAssignment | 2 | 277 | 0.687 | 0.504 | 0.005 |
How do you interpret the results?