
2A Lab 1 Week 2
This is the pair coding activity related to Chapter 1.
The data we will be using in the upcoming lab activities is a randomised controlled trials experiment by Binfet et al. (2021) that was conducted in Canada.
Citation
Binfet, J. T., Green, F. L. L., & Draper, Z. A. (2021). The Importance of Client–Canine Contact in Canine-Assisted Interventions: A Randomized Controlled Trial. Anthrozoös, 35(1), 1–22. https://doi.org/10.1080/08927936.2021.1944558
Abstract
Researchers have claimed that canine-assisted interventions (CAIs) contribute significantly to bolstering participants’ wellbeing, yet the mechanisms within interactions have received little empirical attention. The aim of this study was to assess the impact of client–canine contact on wellbeing outcomes in a sample of 284 undergraduate college students (77% female; 21% male, 2% non-binary). Participants self-selected to participate and were randomly assigned to one of two canine interaction treatment conditions (touch or no touch) or to a handler-only condition with no therapy dog present. To assess self-reports of wellbeing, measures of flourishing, positive and negative affect, social connectedness, happiness, integration into the campus community, stress, homesickness, and loneliness were administered. Exploratory analyses were conducted to assess whether these wellbeing measures could be considered as measuring a unidimensional construct. This included both reliability analysis and exploratory factor analysis. Based on the results of these analyses we created a composite measure using participant scores on a latent factor. We then conducted the tests of the four hypotheses using these factor scores. Results indicate that participants across all conditions experienced enhanced wellbeing on several measures; however, only those in the direct contact condition reported significant improvements on all measures of wellbeing. Additionally, direct interactions with therapy dogs through touch elicited greater wellbeing benefits than did no touch/indirect interactions or interactions with only a dog handler. Similarly, analyses using scores on the wellbeing factor indicated significant improvement in wellbeing across all conditions (handler-only, d = 0.18, p = 0.041; indirect, d = 0.38, p < 0.001; direct, d = 0.78, p < 0.001), with more benefit when a dog was present (d = 0.20, p < 0.001), and the most benefit coming from physical contact with the dog (d = 0.13, p = 0.002). The findings hold implications for post-secondary wellbeing programs as well as the organization and delivery of CAIs.
However, we accessed the data via Ciaran Evans’ github (https://github.com/ciaran-evans/dog-data-analysis). Evans et al. (2023) published a paper that reused the Binfet data for teaching statistics and research methods. If anyone is interested, the accompanying paper is:
Evans, C., Cipolli, W., Draper, Z. A., & Binfet, J. T. (2023). Repurposing a Peer-Reviewed Publication to Engage Students in Statistics: An Illustration of Study Design, Data Collection, and Analysis. Journal of Statistics and Data Science Education, 31(3), 236–247. https://doi.org/10.1080/26939169.2023.2238018
There are a few changes that Evans and we made to the data:
- Evans removed the demographics ethnicity and gender to make the study data available while protecting participant privacy. Which means we’ll have limited demographic variables available, but we will make do with what we’ve got.
- We modified some of the responses in the raw data csv - for example, we took out impossible response values and replaced them with
NA. - We replaced some of the numbers with labels to increase the difficulty in the dataset for Chapter 2 and Chapter 3.
Now, let’s get started!!!
Task 1: Create a project folder for the lab activities
Since we will be working with the same data throughout semester 1, create a separate project for the lab data. Name it something useful, like lab_data or dogs_in_the_lab. Make sure you are not placing it within the project you have already created today. If you need guidance, see Section 1.2.
Task 2: Create a new .Rmd file
… and name it something useful. If you need help, have a look at Section 1.3.
Task 3: Download the data
Download the data here: data_pair_coding. The zip folder contains the raw data file with responses to individual questions, a cleaned version of the same data in long format and wide format, and the codebook describing the variables in the raw data file and the long format.
Unzip the folder and place the data files in the same folder as your project.
Task 4: Familiarise yourself with the data
Open the data files, look at the codebook, and perhaps skim over the original Binfet article (methods in particular) to see what kind of measures they used.
Read in the raw data file as dog_data_raw and the cleaned-up data (long format) as dog_data_long. See if you can answer the following questions.
── Attaching core tidyverse packages ──────────────────────── tidyverse 2.0.0 ──
✔ dplyr 1.1.4 ✔ readr 2.1.5
✔ forcats 1.0.0 ✔ stringr 1.5.1
✔ ggplot2 3.5.2 ✔ tibble 3.3.0
✔ lubridate 1.9.4 ✔ tidyr 1.3.1
✔ purrr 1.1.0
── Conflicts ────────────────────────────────────────── tidyverse_conflicts() ──
✖ dplyr::filter() masks stats::filter()
✖ dplyr::lag() masks stats::lag()
ℹ Use the conflicted package (<http://conflicted.r-lib.org/>) to force all conflicts to become errors
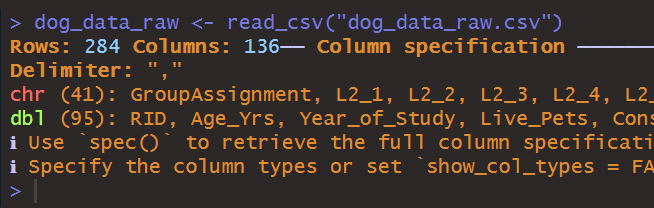
Rows: 284 Columns: 136
── Column specification ────────────────────────────────────────────────────────
Delimiter: ","
chr (41): GroupAssignment, L2_1, L2_2, L2_3, L2_4, L2_5, L2_6, L2_7, L2_8, L...
dbl (95): RID, Age_Yrs, Year_of_Study, Live_Pets, Consumer_BARK, S1_1, HO1_1...
ℹ Use `spec()` to retrieve the full column specification for this data.
ℹ Specify the column types or set `show_col_types = FALSE` to quiet this message.
Rows: 568 Columns: 16
── Column specification ────────────────────────────────────────────────────────
Delimiter: ","
chr (4): GroupAssignment, Year_of_Study, Live_Pets, Stage
dbl (12): RID, Age_Yrs, Consumer_BARK, Flourishing, PANAS_PA, PANAS_NA, SHS,...
ℹ Use `spec()` to retrieve the full column specification for this data.
ℹ Specify the column types or set `show_col_types = FALSE` to quiet this message.Task 5: Question Time
Now that you have familiarised yourself with the data, you can answer the following questions.
Question 1
How many participants took part in the study?
Question 2
How many different questionnaires did the participants answer?
Question 3
dog_data_raw has character columns and that are labeled as double.
You can get information on column specification when reading in the data.
read_csv() when reading in the dataQuestion 4
Select from the dropdown menu the variable type and their data types for each of the columns.
In dog_data_raw:
| Column | Variable type | Data type |
|---|---|---|
RID |
||
GroupAssignment |
||
Age_Yrs |
||
Year_of_Study |
||
PN1_1 |
||
L2_1 |
||
SC2_1 |
In dog_data_long:
| Column | Variable type | Data type |
|---|---|---|
Year_of_Study |
||
Stage |
||
Loneliness |
||
SCS |